One of the key tenets of technical analysis is that pricefrequently lies, but momentum generally speaks the truth. Just asprofessional poker players play the player and not the cards,professional traders trade momentumrather than price. In forex (FX), a robust momentum model can be aninvaluable tool for trading, but traders often grapple with thequestion of what type of model to use. Here we look at how you candesign a simple and effective momentum model in FX using the moving average convergence divergence (MACD) histogram.
Why Momentum?
First, weneed to look at why momentum is so important to trading. A good way tounderstand the significance of momentum is to step outside of the financialmarkets altogether and look at an asset class that has experiencedrising prices for a very long time - housing. House prices are measuredin two ways: month-over-month increases and year-over-year increases.If house prices in New Yorkwere higher in November than in October, then we could safely concludethat demand for housing remained firm and further increases werelikely. However, if prices in November suddenly declined from pricespaid in October, especially after relentlessly rising for most of theyear, then that might provide the first clue to a possible change oftrend. Sure, house prices would most likely still be higher in ayear-over-year comparison, lulling the general public into believingthat the real estate market was still buoyant. However, real estateprofessionals, who are well aware that weakness in housing manifestsitself far earlier in month-over-month figures than in year-over-yeardata, would be far more reluctant to buy under those conditions.
In real estate, month-over-month figures provide a measure of rate of change,which is what the study of momentum is all about. Much like theircounterparts in the real estate market, professionals in the financialmarkets will keep a closer eye on momentum than they do on price toascertain the true direction of a move.
Using the MACD Histogram To Measure Momentum
Rate of change can be measured in a variety of ways in technical analysis; a relative strength index (RSI), a commodity channel index (CCI) or a stochastic oscillatorcan all be used to gauge momentum. However, for the purposes of thisstory, the MACD histogram is the technical indicator of choice. (Tolearn more, see Moving Average Convergence Divergence - Part 2.)
Firstinvented by Gerry Appel in the 1970s, the MACD is one of the simplest,yet most effective, technical indicators around. When used in FX, itsimply records the difference between the 26-period exponential moving average (EMA) and the 12-period exponential moving average of a currency pair. (To learn more, see Trading The MACD Divergence and Basics Of Weighted Moving Averages.)In addition, a nine-period EMA of MACD itself is plotted alongside theMACD and acts as a trigger line. When MACD crosses the nine-period linefrom the bottom, it signifies a change to the upside; when the movehappens in the opposite manner, a downside signal is made.
Thisoscillation of the MACD around the nine-period line was first plottedinto a histogram format by Thomas Aspray in 1986 and became known asthe MACD histogram. Although the histogram is in fact a derivative of aderivative, it can be deadly accurate as a potential guide to pricedirection. Here is one way to design a simple momentum model in FXusing the MACD histogram.1. The first andmost important step is to define a MACD segment. For a long position, aMACD segment is simply the full cycle made by the MACD histogram fromthe initial breach of the 0 line from the underside to the finalcollapse through the 0 line from the topside. For a short, the rulesare simply reversed. Figure 1 shows an example of a MACD segment in theEUR/USD currency pair.
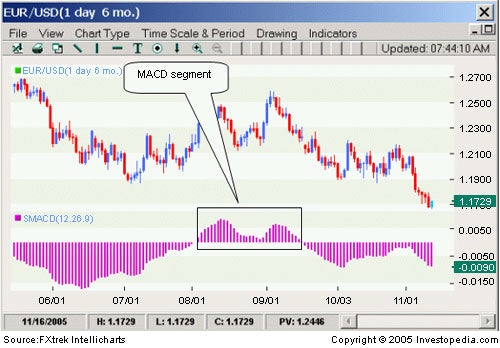
Figure 1 |
2. Once the MACD segment is established, you need to measure thevalue of the highest bar within that segment to record the momentumreference point. In case of a short, the process is simply reversed.
3. Having noted the prior high (or low) in the preceding segment, you canthen use that value to construct the model. Moving on to Figure 2, wecan see that the preceding MACD high was .0027. If the MACD histogramnow registers a downward reading whose absolute value exceeds .0027,then we will know that downward momentum has exceeded upward momentum,and we'll conclude that the present set-up presents a high probabilityshort.
If the case were reversed and the preceding MACDsegment were negative, a positive reading in the present segment thatwould exceed the lowest low of the prior segment would then signal ahigh probability long.
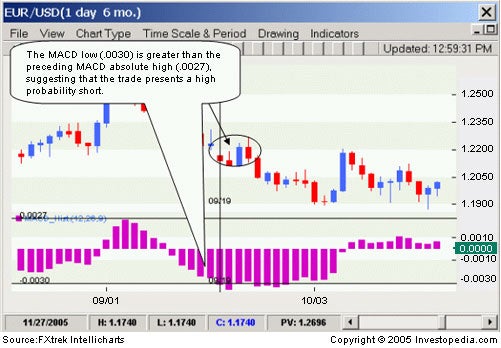
Figure 2 |
What is the logic behind this idea? The basic premise isthat momentum as signified by the MACD histogram can provide clues tothe underlying direction of the market. Using the assumption thatmomentum precedes price, the thesis of the set-up is simply this: a new swing high in momentum should lead to a new swing high in price, and vice versa. Let's think about why this makes sense. A new momentum swing lowor high is usually created when price makes a sudden and violent movein one direction. What precipitates such price action? A belief byeither bulls or bears that price at present levels representsinordinate value, and therefore strong profit opportunity. Typically,these are the early buyers or sellers, and they wouldn't be acting soquickly if they didn't believe that price was going to make asubstantive move in that direction. Generally, it pays to follow theirlead, because this group often represents the "smart money crowd".
However,although this set-up may indeed offer a high probability of success, itis by no means a guaranteed money-making opportunity. Not only will theset-up sometimes fail outright by producing false signals, but it canalso generate a losing trade even if the signal is accurate. Rememberthat while momentum indicates a strong presence of trend, it providesno measure of its ultimate potential. In other words, we may berelatively certain of the direction of the move, but not of itsamplitude. As with most trading set-ups, the successful use of themomentum model is much more a matter of art than science.
Looking at Entry Strategies
Atrader can employ several different entry strategies with the momentummodel. The simplest is to take a market long or market short when themodel flashes a buy or a sell signal. This may work, but it oftenforces the trader to enter at the most inopportune time, as the signalis typically produced at the absolute top or bottom of the price burst.Prices may continue further in the direction of the trade, but it's farmore likely that they will retraceand that the trader will have a better entry opportunity if he or shesimply waits. Figure 3 demonstrates one such entry strategy.

Figure 3 |
Sometimes price will retrace against the direction signal toa far greater degree than expected and yet the momentum signal willremain valid. In that case, some skilled traders will add to theirpositions - a practice that some traders have jokingly termed"SHADDing" (for "short add") or "LADDing" (for "long add"). For thenovice trader, this can be a very dangerous maneuver - there is apossibility that you could end up adding to a bad trade and, therefore,compounding your losses, which could be disastrous. Experiencedtraders, however, know how to successfully "fight the tape" if they perceive that price offers a meaningful divergence from momentum.
Placing Stops and Limits
Thefinal matter to consider is where to place stops or limits in such aset-up. Again, there are no absolute answers, and each trader shouldexperiment on a demo account to determine his or her own risk andreward criteria. (To learn more, see Demo Before You Dive In.) This writer sets his stops at the opposite 1 standard deviation Bollinger Bandsetting away from his entry, as he feels that if price has retreatedagainst his position by such a large amount, the set-up is quite likelyto fail. As for profit targets, some traders like to book gain veryquickly, although more patient traders could reap far larger rewards ifthe trade develops a strong directional move.
Conclusion
Traders often say that the best trade may be the one you don'ttake. One of the greatest strengths of the momentum model is that itdoes not engage in low probability set-ups. Traders can fall prey tothe impulse to try to catch every single turn or move of the currency pair.The momentum model effectively inhibits such destructive behavior bykeeping the trader away from the market when the countervailingmomentum is too strong.
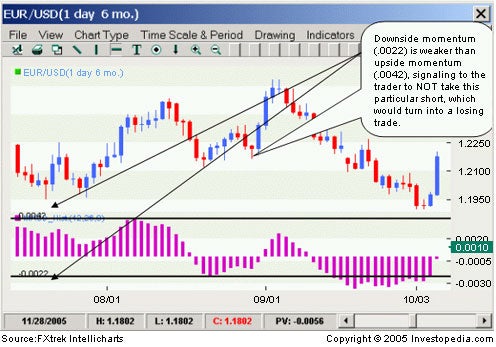
Figure 4 |
As Kenny Rogers once sang in "The Gambler", "You've got to knowwhen to hold them, and you got to know when to fold them". In trading,as in poker, this is the true skill of the game. The simple momentummodel we've described here is one tool that we hope will help currency traders improve their trade selection process and make smarter choices.
by Boris Schlossberg, |


 发表于 2009-12-31 07:12
|
发表于 2009-12-31 07:12
| 

